
Local Pack Rankings by ZIP Code: How to Actually Measure Multi-Location Visibility
A single ranking taken from the center of a ZIP code cannot show how visible a location is across its real market. For useful ZIP code local rank tracking, we need coordinate-level scans, consistent sampling, competitor benchmarks, and clear portfolio reporting.
TL;DR
- Track rankings from several points inside each target ZIP code.
- Use the same keywords, grid points, and schedule for every reporting period.
- Report local pack coverage and competitive gaps, not just average rank.
Why centroid-only tracking under-reports visibility
Many local rank trackers use a single coordinate to represent a ZIP code. This point is often the geographic center, or centroid, of the area.
That approach is simple, but it can be misleading.
Google says local results are influenced by relevance, distance, and prominence. Because distance is part of the ranking system, people searching from different parts of the same ZIP code may see different local pack results.
A business might rank first near its storefront but fall outside the top three a few miles away. Another location may appear weak at the ZIP centroid while performing well in the neighborhoods where most customers live.
A single ranking cannot show that variation.
Centroid-only tracking may overstate visibility when a business ranks well near the center but poorly elsewhere. It may also understate visibility when the centroid is far from the location. In some cases, it can miss gaps near ZIP boundaries, hide overlap between nearby locations, or make competitor coverage look more consistent than it really is.
These problems become more serious when we report on dozens or hundreds of locations.
An executive dashboard might show an average rank of four across the entire portfolio. That number does not tell us whether locations rank consistently across their markets or only near their addresses.
For a more reliable view, we should treat the ZIP code as a reporting area, not as a single search point.
Measure coverage, not only average rank
Average rank is useful, but it should not be the main measure of local visibility.
Consider two locations. Location A ranks first at three points but is not found at seven points. Location B ranks fifth at all ten points.
Their average rankings may look similar depending on how missing results are handled. Their actual visibility is very different.
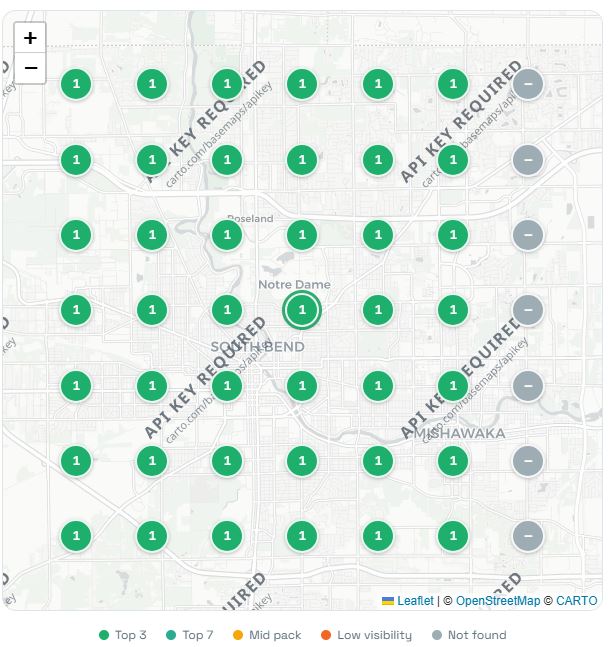
A stronger report includes top-three coverage, which measures the percentage of tracked points where the location appears in the local pack. It should also include detected coverage, average rank where the location is found, and a rank distribution showing how often the business appears in positions 1 to 3, 4 to 10, 11 to 20, or not at all.
Some local rank tracking platforms use similar visibility metrics to show how often a business appears in the top three across a scan area.
These measurements help us distinguish broad visibility from rankings concentrated in a small area.
Building a ZIP-by-ZIP grid for each location
A useful tracking grid should represent where customers are likely to search.
The goal is not to place as many scan points as possible. The goal is to collect enough data to understand visibility without creating unnecessary cost or noise.
Step 1: Assign target ZIP codes to each location
Start by creating a location-to-ZIP table.
Each row should represent one business location and one target ZIP code. The table should include the location ID, Google Business Profile or Maps URL, primary category, target ZIP code, priority level, core keywords, nearby same-brand locations, number of scan points, and reporting owner.
The ZIP code list should reflect the location’s real market. We can define it using customer or patient addresses, sales data, service areas, store catchment data, approved marketing territories, website analytics, or internal market priorities.
This is also where local rank tracking should connect with our site structure strategy, location page guidance, and Google Business Profile management process.
If a ZIP code is important enough to track, we should know which business location and landing page are expected to serve it.
Step 2: Place multiple scan points inside each ZIP code
We should not replace one ZIP centroid with another single point.
Instead, we should place several coordinates throughout the area. These points should represent different sections of the ZIP code, including boundary areas and places with higher customer demand.
A practical starting point is:
- Low-priority ZIP codes: 5 points
- Standard ZIP codes: 9 to 16 points
- High-priority ZIP codes: 25 or more points
These are planning ranges, not fixed rules.
A small ZIP code with limited search activity may need only a few points. A large or highly competitive ZIP code may require a denser grid.
Grid-based local rank tracking tools allow users to change the scan radius and number of points to match the area being measured
Whenever possible, keep scan points inside the target ZIP code. It may also be useful to include a few boundary points when customers regularly cross ZIP lines, two business locations serve overlapping areas, a strong competitor sits just outside the ZIP, or the business operates near the edge of its market.
Step 3: Use a consistent keyword set
Tracking too many keywords creates unnecessary cost and makes reports harder to interpret.
We recommend using a small core set for each location, then adding secondary keywords only where relevant.
The core list should focus on the business’s main non-branded products or services. We can also add high-value modifiers, branded terms, and local intent variations when they reflect real search behavior.
For portfolio reporting, start with three to five core keywords that apply to every location.
This creates a stable benchmark and makes location-to-location comparisons more reliable.
Secondary keywords can be assigned to specific locations based on services, categories, or local demand. We should avoid forcing every branch into the same extended keyword list.
Step 4: Keep the tracking setup consistent
Local rankings naturally move over time. Changing the tracking method at the same time makes it difficult to understand what caused the movement.
For each recurring scan, keep the grid coordinates, keyword spelling, device type, language, search engine, ranking depth, selected business profile, and reporting schedule consistent.
If we change the grid, add keywords, or adjust the radius, we should record the date and create a new baseline.
We should not present a methodology change as organic ranking growth or decline.
Sampling cadence and cost trade-offs
Grid tracking can become expensive because every added element increases the number of ranking checks.
A basic planning formula is:
Total ranking observations = locations × ZIP codes × points × keywords × devices × scans
For instance, a program with 40 locations, 6 ZIP codes per location, 25 points per ZIP, 5 keywords, 1 device, and 12 monthly scans would generate 360,000 ranking observations per year.
That does not mean every business needs that level of tracking.
We should match the sampling frequency to the importance of each location and ZIP code.
Monthly portfolio tracking
Run a consistent monthly scan for all active locations.
This should be the main dataset for executive reporting, quarterly reviews, year-over-year comparisons, portfolio-level visibility trends, and location performance scorecards.
Monthly tracking is usually frequent enough to show meaningful long-term changes without encouraging teams to overreact to short-term movement.
Weekly priority tracking
Use weekly scans for high-revenue ZIP codes, new locations, recently moved locations, declining locations, and highly competitive areas.
Weekly tracking can also help after major website or profile changes.
Several local rank tracking platforms support recurring weekly and monthly reports.
Change-based tracking
Additional scans can be useful before and after a major update.
Common triggers include changing a primary business category, updating an address, launching a location page, correcting a duplicate profile, starting a review campaign, changing internal links, or adding a new service.
One scan should not be treated as proof of improvement.
We should look for a repeated pattern across several points, keywords, and reporting periods.
Control cost without weakening the data
Tracking costs can usually be reduced without weakening the reporting model.
We can use fewer points in low-priority ZIP codes and denser grids in higher-value areas. We can also limit portfolio reports to core keywords, rotate secondary keywords, use one standard device, and rescan only the locations affected by a major change.
Raw point-level data should be stored whenever possible so that future analysis does not depend entirely on the reporting platform.
The objective is not to collect the most data. It is to collect enough consistent data to identify meaningful visibility changes.
Benchmarking against competitors per ZIP
The strongest competitor may change from one ZIP code to another.
It can even change between scan points inside the same ZIP.
Because of this, a fixed national competitor list often gives an incomplete view of local search performance.
We should build the competitive set from the businesses that actually appear in the tracked results.
Create a ZIP-level competitor table
For each ZIP code and keyword, record the competitor name, the number of points where it appears, top-three appearances, average detected rank, coverage rate, review count, rating, primary category, and the points where it ranks above our location.
This makes it easier to identify different competitive patterns.
A persistent competitor appears across most of the ZIP codes and frequently ranks in the top three. A boundary competitor performs well in one section of the ZIP, often near its physical location. An occasional competitor appears only at a few points or for a small number of keywords.
This detail helps us understand whether the visibility gap is broad or limited to one part of the market.
Calculate head-to-head performance
A useful comparison metric is point-level win rate:
Win rate = points where our location ranks higher ÷ points where both businesses appear
We can also calculate the local pack win rate:
Local pack win rate = points where our location ranks in the top three, and the competitor does not ÷ total tracked points
These figures are often easier for stakeholders to understand than a long list of rank positions.
Watch for same-brand overlap
Multi-location businesses should also track when two of their own locations appear for the same keyword.
Same-brand overlap is not always a problem. It may be expected when service areas are close.
However, it may require attention when the wrong location ranks in a target ZIP, two locations repeatedly replace each other, or a location page attracts traffic intended for another branch.
In those cases, we should review location pages, Google Business Profile categories, service details, internal links, and local content.
Our [reviews strategy] may also help strengthen the location that should have greater visibility in the area.
Visualizing visibility heatmaps for stakeholders
A strong local rank report should answer three questions:
- Where are we visible?
- Where are other businesses stronger?
- Is visibility improving?
The visual format should make these answers clear without requiring stakeholders to inspect every ranking point.
Use consistent ranking groups
Use the same rank groups in every report:
- Positions 1 to 3
- Positions 4 to 10
- Positions 11 to 20
- Not found
This is one area where a short list improves clarity.
Keep the ranges and colors consistent across all reporting periods. Changing the scale from one report to another can make weak performance appear stronger or hide a real decline.
Create a location-level heatmap
The heatmap should show the ranking at each scan point, the business location, the ZIP code boundary, priority customer areas, and nearby same-brand locations when relevant.
Use one map per keyword or clearly label any combined metric.
Combining unrelated keywords into one map may hide important differences between products or services.
Add a competitive gap view
A competitive gap map shows where our location ranks above or below the strongest local competitor.
This is often easier to understand than asking stakeholders to compare two separate heatmaps.
The report can show where we lead, where rankings are close, where another business has a clear advantage, and where neither business appears in the local pack.
Build a portfolio scorecard
Executives usually need a summary before they review individual maps.
A portfolio scorecard should include top-three coverage, detected coverage, change from the previous period, improving and declining ZIP codes, the strongest local competitor, same-brand overlap, and priority locations that need attention.
The report should allow users to move from the portfolio view to the location, ZIP code, keyword, and scan point.
Choose a clear weighting method
A portfolio average can be misleading when locations have different numbers of tracked ZIP codes or scan points.
We should choose one weighting method and explain it in the report.
A program may use equal weight per location, equal weight per ZIP code, or weighting based on search demand, revenue, lead volume, or strategic priority.
For executive reporting, we can show two views. Equal location weighting supports operational accountability, while demand-weighted visibility provides a better view of possible business impact.
We should not combine branded and non-branded keywords into one score without clearly labeling the calculation.
They represent different types of search behavior and usually have different levels of ranking difficulty.
FAQ
What is ZIP code local rank tracking?
ZIP code local rank tracking measures a business’s local search visibility from several coordinates within a ZIP code.
The ZIP code is used as the reporting area, while individual grid points provide the ranking data.
How many points should we track in each ZIP code?
A useful starting range is 5 points for low-priority ZIP codes, 9 to 16 points for standard ZIP codes, and 25 or more points for high-priority ZIP codes.
We may need more points when the ZIP code is large, competition is strong, or business locations are close together.
How often should multi-location businesses run local rank scans?
Run a monthly baseline for all locations.
Use weekly scans for high-priority ZIP codes, new locations, major updates, and areas with declining visibility.
Is the average local rank enough for reporting?
No.
Average rank should be reported with top-three coverage, detected coverage, rank distribution, and change over time.
These metrics show whether visibility is broad or concentrated around a few scan points.
How should we compare competitors across ZIP codes?
Use the businesses that appear in the actual grid results.
Compare their coverage, top-three appearances, average detected rank, and head-to-head win rate.
The leading competitor may be different in each ZIP code.
Can two locations from the same brand compete with each other?
Yes.
Nearby locations may appear for the same keywords and replace each other across different scan points. We should review their location pages, profile categories, services, internal links, and target ZIP codes when the wrong location appears.
Sources
- Google Business Profile Help
- Local Falcon reporting documentation
- Local Falcon grid settings
- Local Falcon competitor reports
- BrightLocal local rank tracking
- BrightLocal local search grid documentation
- BrightLocal competitor grid reporting
- Whitespark local ranking grids
- Whitespark multi-location rank tracking

Paul Warren is the co-founder and Head of SEO at the Local Agency and has over 15 years of enterprise SEO experience.